
PIB News Update: National Atlas and Thematic Mapping Organization (NATMO) functioning as a subordinate department under the Department of Science & Technology, Ministry of Science & Technology, Government of India published the 4th updated version of COVID-19 Dashboard on its official Portal at http://geoportal.natmo.gov.in/Covid19/ on 19th June 2020.
The 4th update of COVID19 Dashboard has special attributes like:
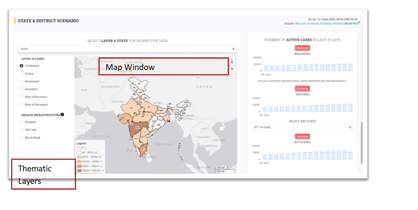
1. A single Map Window through which a user may get a wide range of information related with COVID-19.
Fig1: Single Map frame for COVID Statistics and Health facilities
2. COVID Statistics: Confirmed Cases, Recovered, Deceased, Rate of Recovery, and Rate of Death information have been given state and district wise, while the health facilities Information like – Hospitals, Test Labs, Blood Banks also shown on the same map frame.
Fig 2: State-wise COVID Statistics including Rate of Recovery and Rate of Deceased calculated based on MoHFW data
3. ‘Drill Down’ approach has been adopted to represent the data. Users may select a state to see District wise distribution of COVID cases and available health infrastructural facilities. Users may find individual health facility info at a higher zoomed level. Some useful information to common people like address, categories, and city locations have been indicated with info tool. The cartographic preferences for data visualization has been considered and adopted to ensure easily interpretable data visualization.
Fig 3: State Scenario of Maharashtra showing available heath facilities for Covid19 Treatment and detailed locational information of the facilities. COVID Statistics – Confirmed, Active, Recovered, Deceased cases along with Recovery Rate, Death Rate. COVID Situation of last 15 days has been shown on a graph.
4. States Scenario with an emphasis to last 14 days has been illustrated through charts. First two dominant states in terms of maximum Confirmed Cases are shown by default, and a user may opt to see any other state by choosing the same from the drop-down.
COVID-19, a worldwide health disaster and is a state of global emergency leading towards immense hardships to 217 countries of the world to fight against this deadly disease. India is of no exception, and the first COVID positive case was detected in India on 30th January 2020. Since then, it has created an alarming situation for which Government of India has taken several initiatives to control its adverse impact on Country’s community health, capacitated COVID specific health infrastructure, and spread awareness to control panic-stricken social behaviour.
Under such circumstances, to spread awareness among citizens and to overcome an anxious and worrisome panic most popular approach is the visualisation of situation analysis through Dashboard. NATMO took an initiative to host its COVID19 Dashboard on 14th April 2020 under the guidance of Geospatial Group, Department of Science & Technology, Ministry of Science & Technology, to create a single-window platform to integrate all Government Department data including COVID19 combat initiatives. It has been observed commonly that the other COVID dashboards focus on state/district-wise distribution of COVID cases only. But NATMO, in its dashboard, provisioned dissemination of health infrastructure-related information that may help common people to find relevant information on the issue.
After the initial hosting of COVID19 Dashboard, it has been updated from time to time to keep pace with the changing situation, depending on availability of authenticated thematic information.
COVID19 pandemic has imposed a dynamic scenario which is changing very fast within a short span of time. The Cause-Effect relation may be analyzed further in consideration of demographic-socio-economic factors, which may help us to acquire maximum knowledge from this scenario, considering it is a learning instance. It may help us to fight the battle against such deadly diseases in more empowered way in future days.