
Summary:Researchers are using “fingerprints” left by strong storms on the ocean floor to better understand storms that have already happened and to model and predict how future storms will behave.
Human fingerprints are unique identifiers. The wiggles, curves and ripples cannot be copied or duplicated and provide a distinct signature that represents an individual. In the same way, strong storms — such as Superstorm Sandy — can leave a signature in the form of ripples on the seafloor.
Known as ripple bedforms, these small, dynamic swells are formed when waves generate currents that oscillate back and forth on the seafloor, stirring up sediments and sand. The larger the distance between successive waves on the water’s surface, theoretically, the larger the distance between the peaks of the ripples on the ocean floor below.
According to Carter DuVal, a University of Delaware doctoral student studying oceanography, being able to measure and interpret these ripples can help scientists understand storms that have already happened, and also can help scientists model and predict how future storms will behave.
DuVal is the lead author of a paper recently published in the journalContinental Shelf Research, detailing the use of a fingerprint algorithm to more accurately predict what type of bedforms would be expected with a storm the size and magnitude of Sandy.
Co-authors on the paper include Art Trembanis, associate professor of oceanography in UD’s College of Earth, Ocean, and Environment, and Adam Skarke, a former student of Trembanis who is now an assistant professor of geology at Mississippi State University.
The work is part of a wider study, started by Trembanis and colleagues in 2012 and sponsored by the Office of Naval Research, to examine the ecosystem and to create detailed maps of the seafloor at Redbird Reef, an artificial reef about 16 miles off the coast of the Indian River Inlet. The humanmade structure is comprised of old subway cars, tugboats, tires and military tract vehicles that provide a habitat for marine organisms, while encouraging recreational fishing and diving.
The researchers have mapped Redbird Reef every year since 2008, except 2014. In 2012, they placed sensors and other instruments at Redbird Reef just prior to Hurricane Sandy to measure waves, currents and sand formations on the seafloor. During the height of the storm, the instruments recorded waves over 24 feet high and currents rushing back and forth across the seafloor at 5.2 feet per second.
According to Trembanis, in order to predict erosion, storm surge and overwash at the beach, scientists must correctly predict how a wave will change as it moves across the continental shelf. This is particularly true on the East Coast, which is characterized by a broad, shallow continental shelf.
“At practical levels, if we are going to appropriately predict and model how storms are going to behave, we need to be able to determine ripple parameters, such as wavelength and orientation to the shoreline, with accuracy. Until we began using a fingerprint algorithm, we didn’t have strong enough tools to do this,” said Trembanis.
Storms like Jonas, Joaquin and Sandy, he continued, all contained waves so long that they started to feel the ripples on the ocean floor almost 85 miles offshore. The ripples slow the waves and currents down, fundamentally changing the way they bend and lose energy as they travel across the ocean shelf — and ultimately, how the waves break and end up on the beach.
Part of the fingerprint algorithm’s processing — or job — is to filter out areas that are featureless and focus only on areas with texture or directionality. This strengthened the researchers’ data analysis because it only focuses on areas with ripples.
The algorithm can also tell scientists where there aren’t ripples, which may indicate areas where there is “scour,” meaning erosion, or hidden objects like a mine, pipeline, shipwreck or even unexploded ordinance. New developments
According to DuVal, existing models predict that when a storm begins to wane, the ripples will reduce in size due to the smaller wave conditions. However, using the fingerprint algorithm to analyze data collected during Hurricane Sandy at Redbird Reef revealed that the ripples actually froze at the highest energy of the storm.
“So not only were we seeing a record of the storm, but of the most energetic part of the storm. This is very important for recording the storm’s dynamics,” explained DuVal.
DuVal’s work has focused on extending the fingerprint algorithm to help the researchers analyze the appearance of the ripples, specifically, whether the ripples were straight or curved or something else. Revisiting Redbird Reef multiple times over a year to take measurements and looking at these minute details over large areas, he explained, can help scientists understand a storm’s long-lasting effects, especially how the ripples change over time.
Months after Superstorm Sandy, for example, many of the smaller ripples that were initially present had disappeared, and larger ripples had been smoothed out into what Trembanis calls “relic ripples.”
“Relic ripples that are left behind can become the starting point for the next storm, or because they are somewhat rigid, they may slow down future storms,” Trembanis said. Understanding their directionality, he continued, is important to distinguishing between the two.
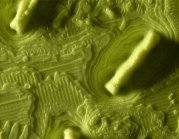
Running a finger across a 3-D printed model of a portion of the reef created from bathymetric sonar images and other data captured after the storm, DuVal is acutely aware of the widespread geographical and structural changes wrought by Superstorm Sandy.
“It gives you a perspective that you cannot get by looking at a two- or three-dimensional map on a screen,” says DuVal. “Not only can we look at the surface, but also the texture too.”
It also reminds DuVal and Trembanis of the timeliness of the work they are doing.
According to the U.S. Environmental Protection Agency, increased greenhouse gas concentrations are expected to “increase the frequency, intensity and/or duration of extreme events.”
“For the Mid-Atlantic, nor’easters really are the dominant storm. What we’ve seen by looking back at the records is that the energy level conditions we measured during Hurricane Sandy have a two and a half to three year recurrence interval,” Trembanis said.
Coincidentally, the researchers recently detected major changes at the Redbird site from winter storm Jonas, including some of the largest ripples they have ever seen. A large Navy barge that previously has been unmoved during Sandy and any other storm also appeared to have been rotated approximately 60 degrees and shifted approximately 160 feet by the January storm according to recent images.
One thing is for sure: the UD researchers will be keeping an eye on the ripples and what they might reveal about the unprecedented weather patterns ahead.
Source:University of Delaware(science)