
The official Wholesale Price Index for ‘All Commodities’ (Base: 2004-05=100) for the month of January, 2017 rose by 1.0 percent to 184.6 (provisional) from 182.8 (provisional) for the previous month.
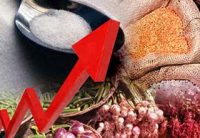
INFLATION
The annual rate of inflation, based on monthly WPI, stood at 5.25% (provisional) for the month of January, 2017 (over January, 2016) as compared to 3.39% (provisional) for the previous month and -1.07% during the corresponding month of the previous year. Build up inflation rate in the financial year so far was 5.31% compared to a build up rate of -0.40% in the corresponding period of the previous year.
Inflation for important commodities / commodity groups is indicated in Annex-1 and Annex-II.
The movement of the index for the various commodity groups is summarized below:-
PRIMARY ARTICLES (Weight 20.12%)
The index for this major group declined by 0.2 percent to 255.7 (provisional) from 256.3 (provisional) for the previous month. The groups and items which showed variations during the month are as follows:-
The index for ‘Food Articles’ group declined by 1.1 percent to 267.2 (provisional) from 270.1 (provisional) for the previous month due to lower price of arhar (15%), gram (14%), masur (7%), urad(6%), moong (4%), egg (3%), fruits & vegetables (2%) and tea, rice, bajra and wheat (1% each). However, the price of jowar (5%), ragi and poultry chicken (4 % each), fish-inland and condiments & spices (2% each) and maize, pork, fish-marine and beef & buffalo meat (1% each) moved up.
The index for ‘Non-Food Articles’ group rose by 2.5 percent to 231.3 (provisional) from 225.6 (provisional) for the previous month due to higher price of flowers (23%), raw rubber (10%), copra (coconut) and raw cotton (7% each), raw silk (6%), sunflower (5%), castor seed and safflower (kardi seed) (3% each) and soyabean (2%). However, the price of mesta (19 %), gingelly seed (4%), cotton seed (3%), linseed, coir fibre, rape & mustard seed and niger seed (2% each) and raw wool and hides(raw) (1% each) declined.
The index for Minerals’ group rose by 1.0 percent to 215.5 (provisional) from 213.3 (provisional) for the previous month due to higher price of manganese ore (16%), copper ore and magnesite (14% each), iron ore (4%), sillimanite and phosphorite (2% each) and chromite (1%). However, the price of crude petroleum (4%) declined.
FUEL & POWER (Weight 14.91%)
The index for this major group rose by 4.7 percent to 201.2 (provisional) from 192.1 (provisional) for the previous month due to higher price of coking coal (84%), aviation turbine fuel (10%), furnace oil (8%), high speed diesel and petrol (5 % each), bitumen (3%) and kerosene (2%).
MANUFACTURED PRODUCTS (Weight 64.97%)
The index for this major group rose by 0.5 percent to 158.8 (provisional) from 158.0 (provisional) for the previous month. The groups and items for which the index showed variations during the month are as follows:-
The index for ‘Food Products’ group rose by 0.4 percent to 194.5 (provisional) from 193.7 (provisional) for the previous month due to higher price of maida and coffee powder (6% each), soyabean oil (4%), rice bran oil, processed prawn and gur (2% each) and copra oil, khandsari, wheat flour (atta), sugar, ghee and palm oil (1% each). However, the price of tea leaf (blended) (5%), tea dust (unblended) and oil cakes (3% each), powder milk and gola (cattle feed) (2% each) and mixed spices and mustard & rapeseed oil (1% each) declined.
The index for ‘ Textiles ‘ group rose by 0.5 percent to 142.3 (provisional) from 141.6 (provisional) for the previous month due to higher price of gunny and hessian cloth (4%), cotton yarn and jute sacking cloth (2% each) and tyre cord fabric and man made fabric (1% each). However, the price of jute sacking bag (1%) declined.
The index for ‘Wood & Wood Products’ group declined by 0.6 percent to 192.6 (provisional) from 193.7 (provisional) for the previous month due to lower price of timber / wooden planks (3%).
The index for ‘Paper & Paper Products’ group rose by 0.4 percent to 157.7 (provisional) from 157.0 (provisional) for the previous month due to higher price of newspaper (5%).
The index for ‘Leather & Leather Products’ group declined by 0.4 percent to 145.5 (provisional) from 146.1 (provisional) for the previous month due to lower price of leather garments & jackets (2%) and leathers (1%).
The index for ‘Rubber & Plastic Products’ group rose by 0.1 percent to 148.6 (provisional) from 148.4 (provisional) for the previous month due to higher price of expandable polystyrene (3%), polyester film and hdpe bag (2% each) and plastic/pvc shoes and hdpe woven fabric (1% each). However, the prices of plastic cabinet (3%), plastic components / accessories (2%) and plastic/ldpe/polythene bag and hdpewoven sacks and other rubber products (1% each) declined.
The index for ‘Chemicals & Chemical Products’ group rose by 0.1 percent to 150.9 (provisional) from 150.7 (provisional) for the previous month due to higher price of basic organic chemicals (2%) and vaccines and photographic goods (1% each). However, the price of synthetic resin (5%), hair / body oils (2%) and di ammonium phosphate, adhesive & gum and antibiotics (1% each) declined.
The index for ‘Non-Metallic Mineral Products’ group declined by 0.4 percent to 178.6 (provisional) from 179.3 (provisional) for the previous month due to lower price of marbles (5%) and polished granite (1%). However, the price of railway sleeper and asbestos corrugated sheet (1% each) moved up.
The index for ‘Basic Metals, Alloys & Metal Products’ group rose by 2.3 percent to 161.2 (provisional) from 157.6 (provisional) for the previous month due to higher price of billets (11%), ferro chrome (9%), pipes/tubes/rods/strips (7 %), pig iron (6%), wire rods (5%), plates, gp/gc sheets, HRC, pencil ingots and melting scrap (4% each), sponge iron, lead, angles, rebars, CRC, zinc and steel structures (3% each), gold & gold ornaments and joist & beams (2% each) and utensils(other than aluminium), rounds, metal containers, steel: pipes & tubes, sheets and silver (1% each). However, the price of pressure cooker (1%) declined.
The index for ‘Machinery & Machine Tools’ group declined by 0.1 percent to 135.4 (provisional) from 135.5 (provisional) for the previous month due to lower price of machine tools (3%), pump & assembly (2%) and fibre optic cable (1%). However, the price of fluorescent tubes (2%) and conductor, computer peripherals, ball/roller bearing, lamps and earth moving machinery (1%) moved up.
The index for ‘Transport, Equipment & Parts’ group declined by 0.1 percent to 139.8 (provisional) from 140.0 (provisional) for the previous month due to lower price of tractors (2%).
FINAL INDEX FOR THE MONTH OF NOVEMBER, 2016 (BASE YEAR: 2004-05=100)
For the month of November, 2016, the final Wholesale Price Index for ‘All Commodities’ (Base: 2004-05=100) stood at 183.5 as compared to 183.1 (provisional) and annual rate of inflation based on final index stood at 3.38 percent as compared to 3.15 percent (provisional) respectively as reported on 14.12.2016.
Next date of press release: 14/03/2017 for the month of February, 2017
Office of Economic Adviser, Ministry of Commerce & Industry, New Delhi,
This press release is available at our home page http://eaindustry.nic.in
Annexure-I
Wholesale Price Index and Rates of Inflation (Base Year: 2004-05=100)
| Month of January, 2017 | |||||||||
| Commodities/Major Groups/Groups/Sub-Groups | Weight | WPI Jan- 2017 | Latest month over month | Build up from March | Year on year | ||||
| 2015-16 | 2016-17 | 2015-16 | 2016-17 | 2015-16 | 2016-17 | ||||
| ALL COMMODITIES | 100.00000 | 184.6 | -0.79 | 0.98 | -0.40 | 5.31 | -1.07 | 5.25 | |
| PRIMARY ARTICLES | 20.11815 | 255.7 | -1.21 | -0.23 | 5.65 | 3.90 | 4.30 | 1.27 | |
| Food Articles | 14.33709 | 267.2 | -1.21 | -1.07 | 7.78 | 2.97 | 6.46 | -0.56 | |
| Cereals | 3.37323 | 254.9 | 1.18 | -0.27 | 4.11 | 5.64 | 2.91 | 5.94 | |
| Rice | 1.79348 | 246.0 | 0.67 | -0.69 | 2.27 | 3.06 | -0.13 | 2.97 | |
| Wheat | 1.11595 | 250.3 | 2.47 | -0.56 | 6.08 | 9.68 | 5.54 | 9.49 | |
| Pulses | 0.71662 | 393.4 | -2.14 | -12.01 | 43.68 | 13.54 | 45.03 | 6.21 | |
| Vegetables | 1.73553 | 196.2 | -8.14 | -7.06 | 33.72 | -7.63 | 12.71 | -32.32 | |
| Potato | 0.20150 | 151.2 | -12.78 | -31.15 | 0.20 | -6.15 | -17.08 | -0.20 | |
| Onion | 0.17794 | 252.4 | -13.23 | -1.71 | 6.71 | -7.75 | 7.45 | -28.86 | |
| Fruits | 2.10717 | 240.2 | -0.90 | 2.61 | -4.88 | 1.14 | -2.03 | 3.58 | |
| Milk | 3.23818 | 261.3 | -0.04 | 0.04 | 1.42 | 2.91 | 1.42 | 4.19 | |
| Egg, Meat & Fish | 2.41384 | 308.6 | 0.44 | 1.28 | 2.69 | 2.59 | 5.90 | 3.59 | |
| Non-Food Articles | 4.25756 | 231.3 | 1.16 | 2.53 | 11.94 | 5.23 | 9.35 | 1.98 | |
| Fibres | 0.87737 | 246.6 | 2.59 | 5.61 | 10.70 | 18.05 | 7.97 | 15.18 | |
| Oil Seeds | 1.78051 | 211.3 | -1.51 | 0.09 | 5.19 | -0.14 | 5.76 | -1.72 | |
| Minerals | 1.52350 | 215.5 | -9.10 | 1.03 | -29.39 | 11.72 | -29.27 | 25.44 | |
| FUEL & POWER | 14.91021 | 201.2 | -3.68 | 4.74 | -9.41 | 16.71 | -9.89 | 18.14 | |
| Liquefied petroleum gas | 0.91468 | 167.0 | 0.98 | 0.42 | 1.11 | 4.31 | -1.26 | 1.52 | |
| Petrol | 1.09015 | 178.7 | -1.78 | 4.69 | -6.42 | 20.09 | -5.45 | 15.66 | |
| High speed diesel | 4.67020 | 228.9 | -3.91 | 4.76 | -14.07 | 24.88 | -13.00 | 31.10 | |
| MANUFACTURED PRODUCTS | 64.97164 | 158.8 | 0.20 | 0.51 | -0.78 | 3.05 | -1.17 | 3.99 | |
| Food Products | 9.97396 | 194.5 | 1.03 | 0.41 | 3.88 | 8.30 | 2.79 | 10.07 | |
| Sugar | 1.73731 | 221.7 | 5.43 | 1.14 | 3.44 | 16.50 | -0.55 | 22.83 | |
| Edible Oils | 3.04293 | 158.2 | -0.67 | 0.64 | 2.83 | 5.68 | 1.64 | 6.25 | |
| Beverages, Tobacco & Tobacco Product | 1.76247 | 221.9 | 0.00 | 0.00 | 1.43 | 4.77 | 2.13 | 7.67 | |
| Cotton Textiles | 2.60526 | 162.3 | 0.13 | 0.93 | -1.52 | 4.17 | -2.14 | 4.51 | |
| Man Made Textiles | 2.20573 | 129.8 | -0.62 | 0.08 | -2.79 | 0.54 | -2.72 | 0.70 | |
| Wood & Wood Products | 0.58744 | 192.6 | 0.31 | -0.57 | 3.27 | -2.23 | 3.49 | -1.68 | |
| Paper & Paper Products | 2.03350 | 157.7 | 0.32 | 0.45 | 1.70 | 1.22 | 2.78 | 1.41 | |
| Leather & Leather Products | 0.83509 | 145.5 | 0.35 | -0.41 | 1.97 | -0.21 | 1.75 | 0.28 | |
| Rubber & Plastic Products | 2.98697 | 148.6 | -0.14 | 0.13 | -2.02 | 2.27 | -2.15 | 2.27 | |
| Chemicals & Chemical Products | 12.01770 | 150.9 | -0.20 | 0.13 | -0.93 | 0.87 | -1.32 | 0.94 | |
| Non-Metallic Mineral Products | 2.55597 | 178.6 | -0.11 | -0.39 | -0.34 | 0.11 | 1.83 | 0.28 | |
| Cement & Lime | 1.38646 | 174.3 | -0.69 | -0.34 | -2.36 | -0.80 | 1.05 | 0.46 | |
| Basic Metals Alloys & Metal Product | 10.74785 | 161.2 | -0.13 | 2.28 | -7.78 | 5.08 | -9.30 | 7.97 | |
| Iron & Semis | 1.56301 | 143.6 | 0.68 | 4.21 | -11.01 | 5.36 | -13.46 | 8.38 | |
| Machinery & Machine Tools | 8.93148 | 135.4 | -0.15 | -0.07 | -0.22 | 0.22 | -0.44 | 0.52 | |
| Transport Equipment & Parts | 5.21282 | 139.8 | 0.65 | -0.14 | 1.17 | 0.58 | 1.46 | 0.65 | |
|
Annexure-II |
||||||||
| Trend of Rate of Inflation for some important items during last six months | ||||||||
| Commodities/Major Groups/Groups/Sub-Groups | Weight (%) | Rate of Inflation for the last six months | |||||||||||||||||||||||||||||
| Jan-17 | Dec-16 | Nov-16 | Oct-16 | Sept-16 | Aug-16 | ||||||||||||||||||||||||||
| ALL COMMODITIES | 100.00 | 5.25 | 3.39 | 3.38 | 3.79 | 3.80 | 3.85 | ||||||||||||||||||||||||
| PRIMARY ARTICLES | 20.12 | 1.27 | 0.27 | 1.95 | 4.18 | 5.36 | 7.75 | ||||||||||||||||||||||||
| Food Articles | 14.34 | -0.56 | -0.70 | 2.10 | 4.79 | 6.39 | 8.87 | ||||||||||||||||||||||||
| Cereals | 3.37 | 5.94 | 7.49 | 9.61 | 8.34 | 9.07 | 9.51 | ||||||||||||||||||||||||
| Rice | 1.79 | 2.97 | 4.38 | 7.29 | 7.04 | 7.10 | 7.38 | ||||||||||||||||||||||||
| Wheat | 1.12 | 9.49 | 12.82 | 13.83 | 9.17 | 9.97 | 10.34 | ||||||||||||||||||||||||
| Pulses | 0.72 | 6.21 | 18.12 | 21.78 | 22.02 | 23.99 | 34.24 | ||||||||||||||||||||||||
| Vegetables | 1.74 | -32.32 | -33.11 | -23.74 | -10.01 | -10.91 | 0.23 | ||||||||||||||||||||||||
| Potato | 0.20 | -0.20 | 26.42 | 36.82 | 60.58 | 73.60 | 67.17 | ||||||||||||||||||||||||
| Onion | 0.18 | -28.86 | -37.20 | -51.51 | -66.06 | -70.59 | -64.19 | ||||||||||||||||||||||||
| Fruits | 2.11 | 3.58 | 0.04 | 2.41 | 6.03 | 14.14 | 13.91 | ||||||||||||||||||||||||
| Milk | 3.24 | 4.19 | 4.11 | 4.19 | 4.35 | 4.43 | 4.20 | ||||||||||||||||||||||||
| Egg, Meat & Fish | 2.41 | 3.59 | 2.73 | 5.82 | 6.20 | 7.44 | 8.75 | ||||||||||||||||||||||||
| Non-Food Articles | 4.26 | 1.98 | 0.62 | 0.00 | 2.49 | 4.67 | 8.72 | ||||||||||||||||||||||||
| Fibres | 0.88 | 15.18 | 11.88 | 14.05 | 17.91 | 19.32 | 25.13 | ||||||||||||||||||||||||
| Oil Seeds | 1.78 | -1.72 | -3.30 | -5.05 | -3.15 | 2.25 | 7.21 | ||||||||||||||||||||||||
| Minerals | 1.52 | 25.44 | 12.86 | 5.85 | 1.39 | -3.79 | -7.37 | ||||||||||||||||||||||||
| FUEL & POWER | 14.91 | 18.14 | 8.65 | 7.07 | 6.24 | 5.64 | 1.62 | ||||||||||||||||||||||||
| Liquefied petroleum gas | 0.91 | 1.52 | 2.09 | 1.87 | 0.94 | -0.74 | -1.85 | ||||||||||||||||||||||||
| Petrol | 1.09 | 15.66 | 8.52 | 5.54 | 3.57 | 1.25 | -8.65 | ||||||||||||||||||||||||
| High speed diesel | 4.67 | 31.10 | 20.25 | 19.26 | 19.32 | 19.08 | 12.15 | ||||||||||||||||||||||||
| MANUFACTURED PRODUCTS | 64.97 | 3.99 | 3.67 | 3.14 | 2.94 | 2.54 | 2.48 | ||||||||||||||||||||||||
| Food Products | 9.97 | 10.07 | 10.75 | 10.73 | 10.93 | 11.38 | 11.93 | ||||||||||||||||||||||||
| Sugar | 1.74 | 22.83 | 28.04 | 32.00 | 30.94 | 32.86 | 35.36 | ||||||||||||||||||||||||
| Edible Oils | 3.04 | 6.25 | 4.87 | 3.85 | 4.46 | 6.14 | 6.51 | ||||||||||||||||||||||||
| Beverages, Tobacco & Tobacco Product | 1.76 | 7.67 | 7.67 | 7.56 | 7.67 | 7.67 | 7.72 | ||||||||||||||||||||||||
| Cotton Textiles | 2.61 | 4.51 | 3.68 | 3.48 | 3.59 | 3.20 | 2.29 | ||||||||||||||||||||||||
| Man Made Textiles | 2.21 | 0.70 | 0.00 | -0.92 | -0.84 | -1.06 | -2.41 | ||||||||||||||||||||||||
| Wood & Wood Products | 0.59 | -1.68 | -0.82 | -0.25 | 0.41 | 3.30 | 3.04 | ||||||||||||||||||||||||
| Paper & Paper Products | 2.03 | 1.41 | 1.29 | 1.81 | 0.97 | 1.10 | 1.49 | ||||||||||||||||||||||||
| Leather & Leather Products | 0.84 | 0.28 | 1.04 | 1.45 | 1.87 | 0.07 | 0.55 | ||||||||||||||||||||||||
| Rubber & Plastic Products | 2.99 | 2.27 | 1.99 | 1.44 | 1.02 | 0.61 | -0.34 | ||||||||||||||||||||||||
| Chemicals & Chemical Products | 12.02 | 0.94 | 0.60 | 0.47 | 0.13 | -0.07 | -0.33 | ||||||||||||||||||||||||
| Non-Metallic Mineral Products | 2.56 | 0.28 | 0.56 | 0.06 | 1.92 | 1.64 | 2.22 | ||||||||||||||||||||||||
| Cement & Lime | 1.39 | 0.46 | 0.11 | -0.91 | 2.54 | 1.95 | 3.61 | ||||||||||||||||||||||||
| Basic Metals Alloys & Metal Product | 10.75 | 7.97 | 5.42 | 3.03 | 1.23 | -0.90 | -1.49 | ||||||||||||||||||||||||
| Iron & Semis | 1.56 | 8.38 | 4.71 | 1.63 | -0.36 | -6.26 | -6.88 | ||||||||||||||||||||||||
| Machinery & Machine Tools | 8.93 | 0.52 | 0.44 | 0.44 | 0.37 | 0.22 | 0.22 | ||||||||||||||||||||||||
| Transport Equipment & Parts | 5.21 | 0.65 | 1.45 | 1.30 | 1.45 | 1.60 | 1.60 | ||||||||||||||||||||||||