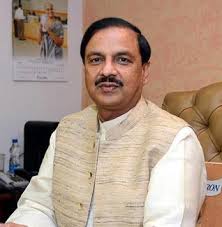
Dr. Mahesh Sharma, Minister of State for Culture and Tourism (Independent Charge) and Minister of State for Civil Aviation has informed that there are various national level museums, namely National Museum (New Delhi), 3 wings of National Gallery of Modern Art (Delhi, Bengaluru, Mumbai), Indian Museum (Kolkata), Victoria Memorial Hall (Kolkata), Salarjung Museum (Hyderabad), 23 Science Centre under National Council of Science Museum (Kolkata) and Allahabad Museum (Allahabad), which are directly under the administrative control of the Ministry of Culture. Besides, there are forty four site museums under the control of Archaeological Survey of India (ASI). These museums have a large collection of artefacts, paintings, sculptures, coins etc. Upgradation and modernization of these museums are taken up by the Government from time to time. These museums are in good condition.
The Government has initiated 14 point agenda on museum reforms in 2009 as a continuous process to bring qualitative changes in museums in India to keep pace with the international developments in the field. The condition of the museums is upgraded/modernized periodically in a time bound manner.
Details of fund allocated for maintaining the above museums and the funds sanctioned for various other museums under the Museum Grant Scheme is given below:-
| The Amount Allocated for Preservation of Museums and Artifacts during the Last Three Years, State/UT and Year-wise(Rs. in lakh) | ||||
| S. No. | State | 2013-14 | 2014-15 | 2015-16 |
| 1. | Andhra Pradesh | 76.69 | 45.50 | 349.81 |
| 2. | Jammu & Kashmir | 313.25 | – | 252.77 |
| 3. | Himachal Pradesh | 58.14 | 10.25 | 3.20 |
| 4. | Madhya Pradesh | 365.43 | 307.28 | 84.17 |
| 5. | Mizoram | – | – | 50.00 |
| 6. | Punjab | 9.00 | 30.50 | 105.57 |
| 7. | Rajasthan | 147.65 | 65.12 | 249.35 |
| 8. | Telangana | 10.00 | 325.08 | – |
| 9. | Uttarakhand | 7.20 | 466.13 | 6.77 |
| 10. | Arunachal Pradesh | 129.1 | 99.665 | 469.714 |
| 11. | Haryana | 173.74 | 55.15 | 85.61 |
| 12. | Kerala | 295.48 | 103.25 | 148.50 |
| 13. | West Bengal | 448.59 | 239.19 | 801.70 |
| 14. | Assam | 16.15 | 47.46 | 32.56 |
| 15. | Gujarat | 38.43 | 33.00 | 31.6 |
| 16. | Karnataka | 64.93 | 62.51 | 209.9 |
| 17. | Manipur | 41.09 | – | 21.79 |
| 18. | Maharashtra | 300.00 | 46.92 | 341.085 |
| 19. | Nagaland | 9.93 | 36.79 | – |
| 20. | Odisha | 119.4 | 38.30 | 116.1 |
| 21. | Tamilnadu | 112.57 | 80.22 | 91.59 |
| 22. | Uttar Pradesh | 127.65 | 450.77 | 288.55 |
| 23. | Bihar | 38.81 | 41.00 | 68.07 |
| 24. | Goa | 22.50 | 20.25 | 14.00 |
| S.No. | UT | 2013-14 | 2014-15 | 2015-16 |
| 1. | Delhi | 125.7 | 107.00 | 110.75 |



Leave a Reply
You must be logged in to post a comment.